About the Kansas Assessment Program
The Kansas Assessment Program (KAP) includes a set of untimed, computerized tests in English language arts (ELA), mathematics, and science that align to the Kansas Content Standards.
Test Purpose
KAP provides parents, educators, and policymakers with information about student learning. Additionally, KAP meets federal and state accountability requirements.
Test Content
All students in grades 3-8 and 10 took assessments in ELA and mathematics. Students in grades 5, 8, and 11 took an assessment in science.
Test Format
Computerized tests allow students to demonstrate knowledge in various ways. In addition to multiple-choice items, students see technologyenhanced (TE) items. Depending on the subject area, TE items might include ordering, matching, or completing a matrix.
How are KAP assessments scored?
First, the points your student earned on the test questions are added together without deducting points for incorrect answers. Some questions are worth more than one point. Next, this raw score is converted to a scale score that has the same meaning for all versions of the test. KAP scale scores range from 400-700 and are divided into four performance levels.
Your student’s performance in different categories of each subject-area test, such as Key Ideas & Details in ELA or Algebra in mathematics, is calculated by comparing a student’s performance with the state average in that same specific category.
What are scale scores?
KAP score reports relay information about students’ performance in terms of scale scores. A scale score is a mathematical conversion of the total number of points a student earned on an assessment into a score along a predefined scale, which allows for consistent reporting of assessment results across years for any specific grade and subject area. Scale scores on all KAP assessments range from 400 to 700.
Scale scores help compare your student’s performance to the expectations of proficiency for the grade level and subject area. Students in Level 3 and 4 have reached those expectations. Students in Level 1 and 2 are still working toward reaching proficiency.
It also may be helpful to compare your student’s scale score to the average performance of the building, the district, and the state overall. This helps us to understand how the student is performing relative to other students in that same grade level. 2
Schools and districts also use these scale scores to compare the performance of entire groups of students. For example, they might compare how students in third grade did on the assessment this year versus how third graders did on the assessment last school year. But because the content being tested changes each year, scale scores tell us far less about how a student performed in third grade versus how that student performed in fourth grade. It is better to use Performance Levels to compare year to year.
NOTE: The 2023-2024 KAP summative assessment was on a different scale with different Performance Level cut scores. Therefore, it is not advisable to compare results from this year to last year
What are Performance Level Descriptors?
Performance Level Descriptors (PLDs) define the knowledge, skills, and processes that students likely demonstrate at different levels of proficiency within the reporting categories (1, 2, 3, 4).
These PLDs appear on Individual Student Reports and describe student performance on the assessment.
Level 1: A student at Level 1 shows a limited ability to demonstrate their knowledge and skills of (third, fourth, fifth, etc.) grade (ELA, Math, Science) standards.
Level 2: A student at Level 2 shows a basic ability to demonstrate their knowledge and skills of (third, fourth, fifth, etc.) grade (ELA, Math, Science) standards.
Level 3: A student at Level 3 shows a proficient ability to demonstrate their knowledge and skills of (third, fourth, fifth, etc.) grade (ELA, Math, Science) standards.
Level 4: A student at Level 4 shows an advanced ability to demonstrate their knowledge and skills of (third, fourth, fifth, etc.) grade (ELA, Math, Science) standards.
What are cut scores?
Cut scores are specific points on a test’s scoring scale that separate different levels of student performance. They determine the minimum score a student must achieve to be placed into a particular performance category – Limited, Basic, Proficient, Advanced. Cut scores are generally different for each grade and subject; however, for all KAP assessments the Level 2 cut score is fixed at 510 and the Level 3 cut score is fixed at 540. The Level 4 cut score varies from grade to grade across subjects. To understand how your student performed on the assessment, visit with your teachers or school leaders.
English Language Arts
| Grade | Lowest Score | Level 2 Cut Score | Level 3 Cut Score | Level 4 Cut Score | Highest Score |
|---|---|---|---|---|---|
| 3 | 400 | 510 | 540 | 609 | 700 |
| 4 | 400 | 510 | 540 | 607 | 700 |
| 5 | 400 | 510 | 540 | 600 | 700 |
| 6 | 400 | 510 | 540 | 593 | 700 |
| 7 | 400 | 510 | 540 | 600 | 700 |
| 8 | 400 | 510 | 540 | 594 | 700 |
| 10 | 400 | 510 | 540 | 588 | 700 |
Mathematics
| Grade | Lowest Score | Level 2 Cut Score | Level 3 Cut Score | Level 4 Cut Score | Highest Score |
|---|---|---|---|---|---|
| 3 | 400 | 510 | 540 | 570 | 700 |
| 4 | 400 | 510 | 540 | 579 | 700 |
| 5 | 400 | 510 | 540 | 599 | 700 |
| 6 | 400 | 510 | 540 | 596 | 700 |
| 7 | 400 | 510 | 540 | 603 | 700 |
| 8 | 400 | 510 | 540 | 594 | 700 |
| 10 | 400 | 510 | 540 | 600 | 700 |
Science
| Grade | Lowest Score | Level 2 Cut Score | Level 3 Cut Score | Level 4 Cut Score | Highest Score |
|---|---|---|---|---|---|
| 5 | 400 | 510 | 540 | 582 | 700 |
| 8 | 400 | 510 | 540 | 569 | 700 |
NOTE: The Grade 11 Science assessment did not have the range of scores needed to complete standard setting and establish cut scores. More information about the Grade 11 assessment will be shared when available.
How should you use the KAP results?
Use these scores to help:
- Identify your student’s relative strengths and areas for improvement.
- Determine your student’s progress toward meeting state curriculum standards.
- Compare your student’s performance to that of other students in the school, district, and state.
How can you help your child improve his or her KAP score?
Make reading a daily habit with books or articles that challenge and excite your child.
- Make reading a daily habit with books or articles that challenge and excite your child.
- Celebrate effort and progress to encourage your child to do their best on assessments.
- Chat with teachers about fun ways to build your child’s critical-thinking skills.
- Spark curiosity with open-ended questions. Invite your child to write stories or solve math problems using real-life examples like maps, sports scores, or recipes.
- Use the report as a guide to pinpoint areas for growth and ask teachers for tips to practice at home.
- Try Kite Practice Tests together to help your child feel confident and ready.
What are the tests like?
KAP tests are taken online through Kite Student Portal. If you would like to see Student Portal in action, Practice Tests are available online. Refer to the Kite Practice Test Guide for information about accessing these Practice Tests.
Student Report Walkthrough
1
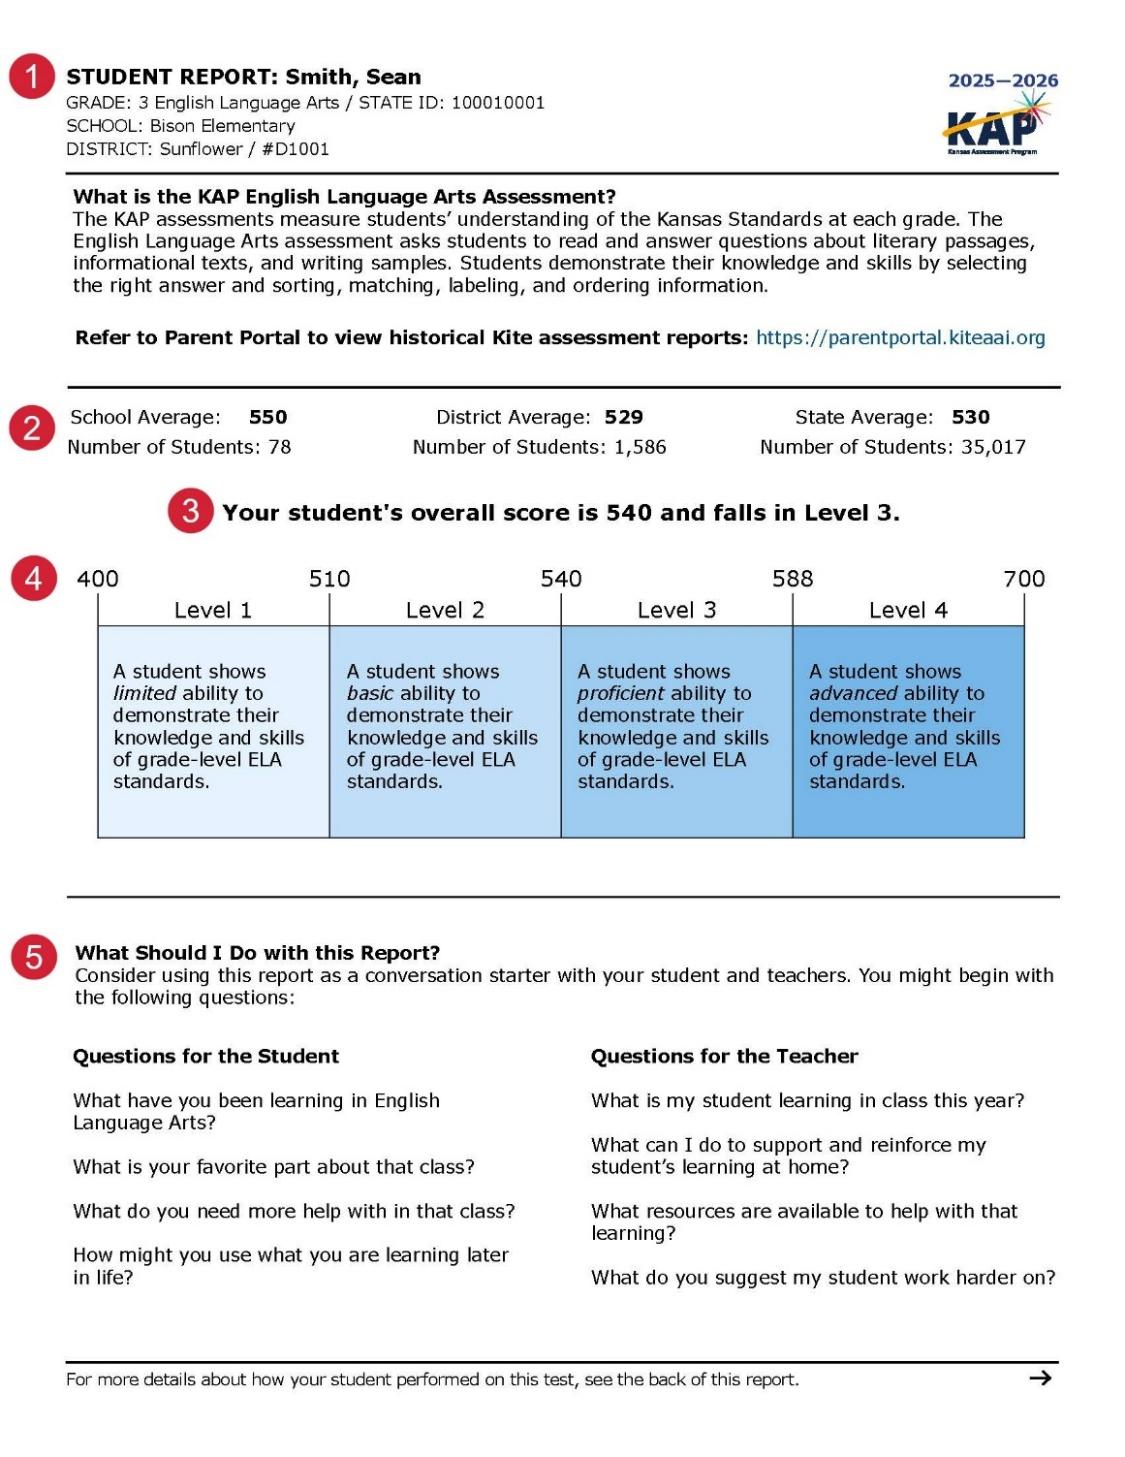
The Individual Student Report (ISR) includes a student’s name, grade level, subject, state ID, school, and district. Below that is a description of the assessment that your student took this year. If your district uses Kite Parent Portal, you can access historical assessment reports at the link shown.
2
This section of the report provides the school, district and state score averages. Also shown is the number of students in each group.
3
Your student’s scale score and performance level are shown here.
4
Students receive an overall scale score and, based on that score, are placed in one of four performance levels. The performance level descriptors, or PLDs, define the knowledge, skills, and processes that students likely demonstrate at different levels of proficiency. This section also shows the score range for each level.
5
This section of the report shows what you can do to assist your student. Use these questions to help start a conversation with your student and teacher.
6
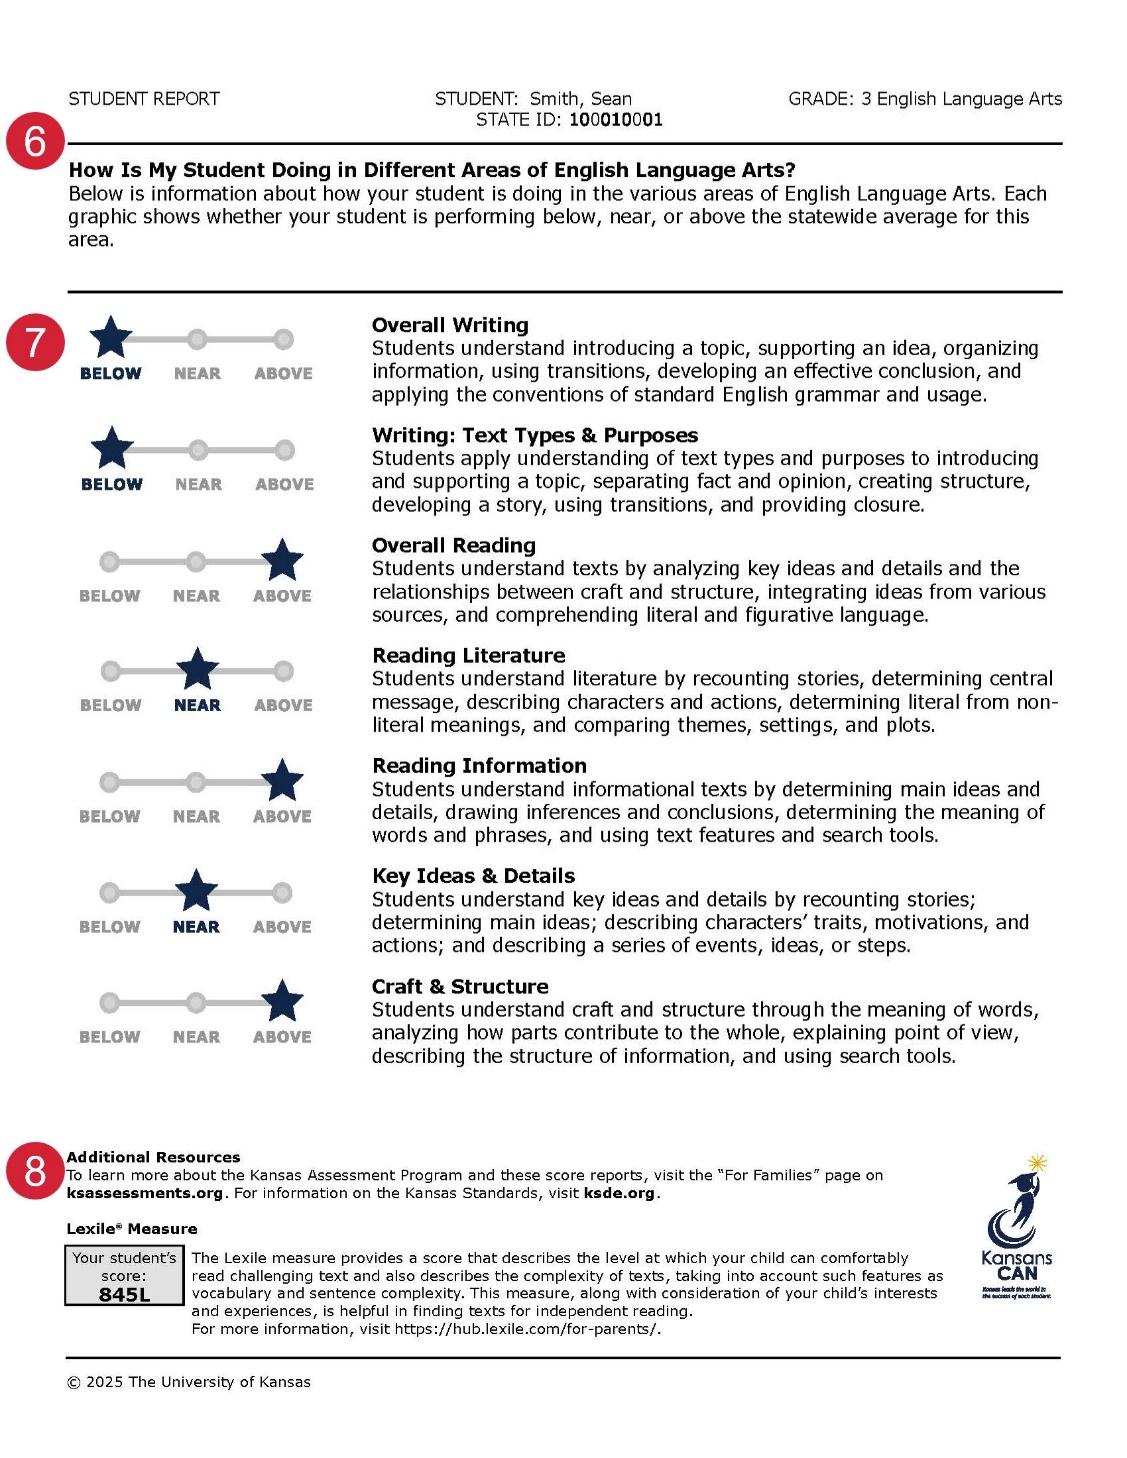
Each subject is broken down into different categories and these categories have a sub-score attached to them. This section describes how to interpret these sub-scores.
7
This section shows a student’s relative strengths and areas for improvement. The Below, Near, and Above designations compare your student’s performance to other students across the state. Each category represents a group of test questions that assess related skills. All subjects have main categories. In ELA and mathematics, some of the main categories are broken down further into subcategories. For example, in ELA, the Overall Reading category is made up of four subcategories: Reading Literature, Reading Information, Key Ideas & Details, and Craft & Structure.
8
On the lower half of this page, you will find links to helpful information and resources that you can use to help your child improve their score. On ELA score reports, your child’s Lexile Measure is displayed. On math score reports, your child’s Quantile Measure is displayed. A description of these Measures is also provided here, along with a link for more information about the measures.